GoThru Google Statistics
The Google panorama views stats by GoThru lets you see how your virtual tour is performing at a glance. It shows a more detailed picture of reports you would see on the portfolio page.
The stats provides you with key information that can help in making an informed decision to boost the display of a panorama through Google Products, Overlays or Website Embeds. Display means displaying the full panorama or just the thumbnail.
In the Gstats report you will also see in Overview of the top performing three panoramas weekly or week by week. Using this report, you can also find out which panorama is performing the best.
How to see GoThru Google Statistics
1. Click on the Portfolio tab on the top bar.

2. Navigate to the tour that you want to view. Press the Stats button.

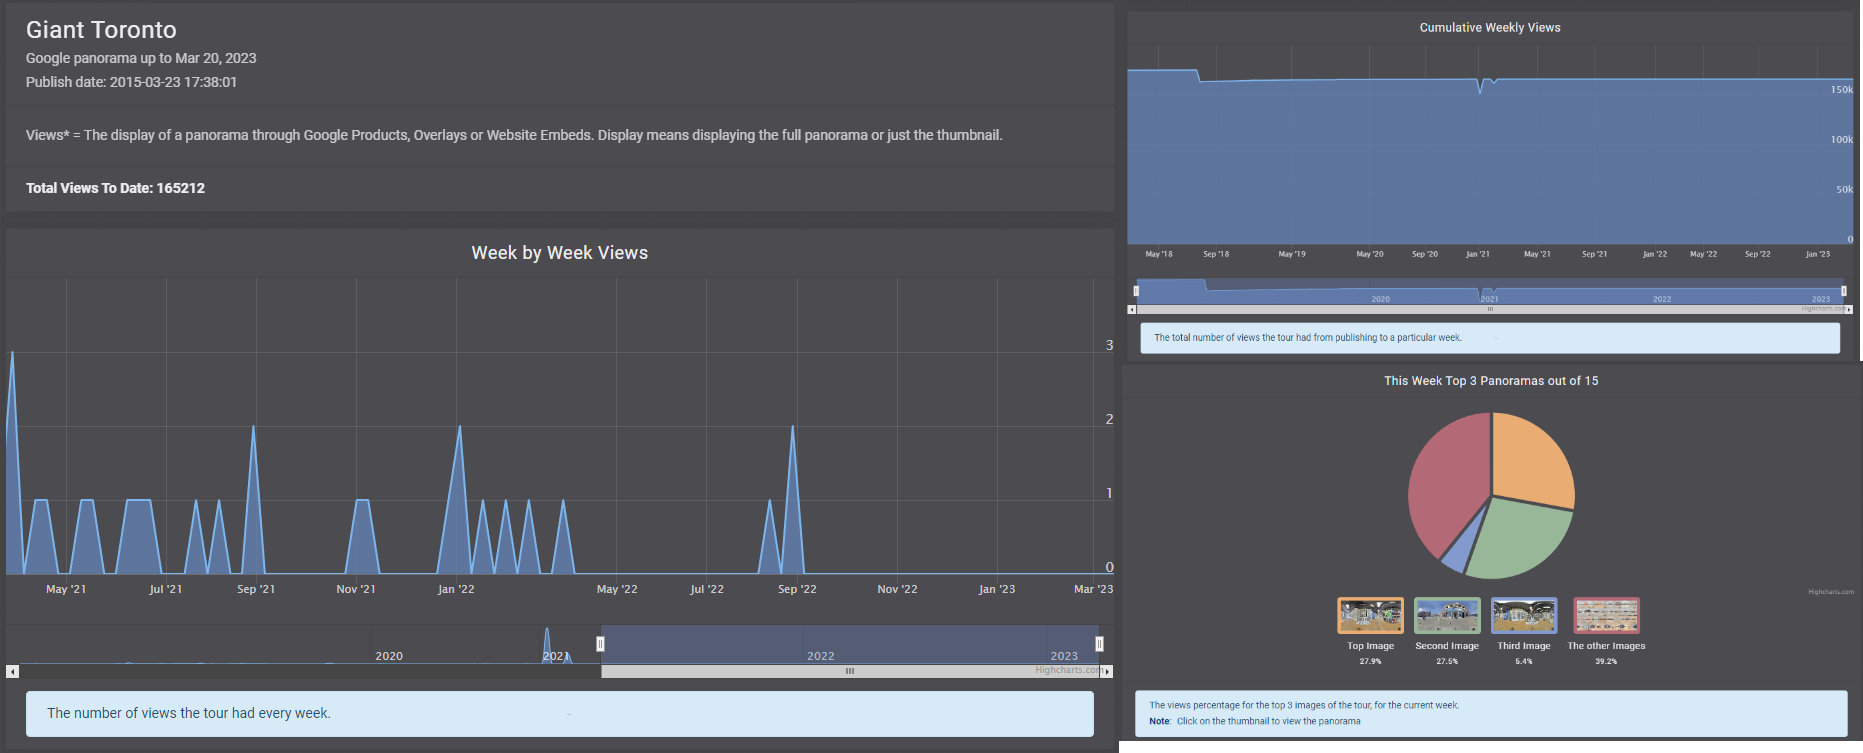
3. It will redirect you to GStats.co. You will get a report where you can see the tour traffic week by week, cumulative weekly views, this week top 3 panoramas and week by week top 3 panoramas.
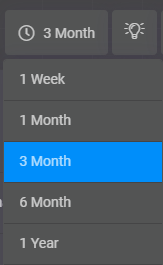
4. The record date range selector at the top right allows you to select the record date and the time range of the statistics.
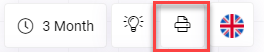
5. You can export these GStats to a PDF file, so others can also view or print it.
GStats metrics explained
Week by Week Views - The number of views the tour had every week.
In the following Gstats, w23 (week 23) - means the 23th week of the current year.

Cumulative Weekly Views -The total number of views the tour had from publishing to a particular week.
Note: w23- means the 23th week of the current year.

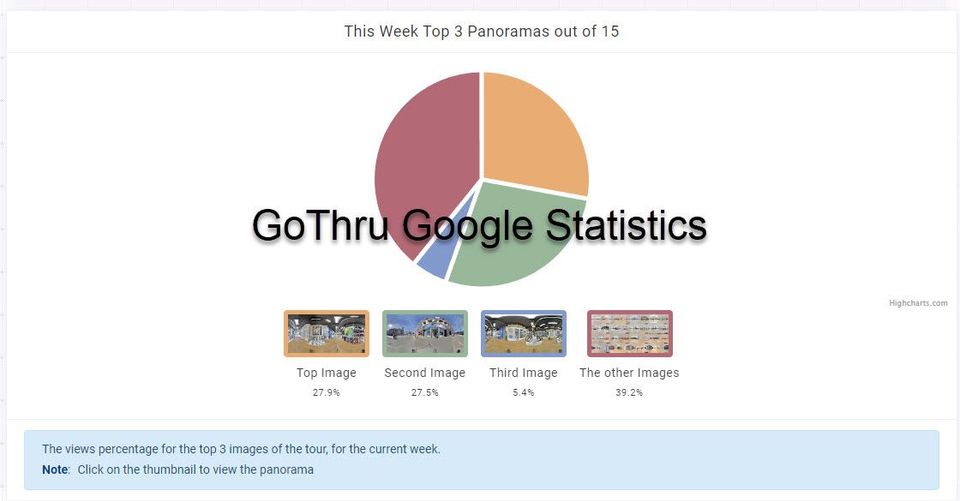
This Week Top 3 Panoramas out of - The views percentage for the top 3 images of the tour, for the current week.

Week by Week Top 3 Panoramas out of - The number of views for the top 3 images of the tour, per week.
Note: w23- means the 23th week of the current year.
